

Unraveling Aurora DSQL Pricing
Aurora DSQL has been in general availability, but it is still a new service and there are many unknowns about it. The pricing model is also new and different from other AWS services, so I wanted to experiment and understand how it works in practice and speculate here and there.
Update: I did the majority of this work earlier in October 2025. The detailed billing formulas appear to have been added to the Aurora DSQL docs later, around late November 2025, so they were not something I had available when I first did the benchmarks. I have since updated this post with the documented DPU formulas from the Aurora DSQL billing and metering docs, and the April 2026 rerun below compares my measurements with those formulas.
Aurora DSQL?
- New serverless distributed database service!
- No capacity limits compared to Aurora Serverless v2
- Always Instantly Available
- No hourly fees
- Cost in us-east-1 is defined as $8.00 per 1M Units of DPUs and $0.33 per GB-month in Storage
- 100,000 DPUs and 1 GB of storage Free tier per month
But what is a DPU?
From AWS pricing:
Aurora DSQL charges for all database activity using a billing unit called the Distributed Processing Unit (DPU). DPU measures how much work the system does to run your SQL workload. This includes compute resources used to execute query logic (e.g., joins, functions, aggregations) as well as the input/output (I/O) required to read from and write to storage. Aurora DSQL tracks this work in real time and bills only for active usage. When your cluster is idle, usage automatically scales to zero and you incur no DPU charges.
After reading the pricing page alone I'm still not happy. There's no frame of reference to anything else. Can't compare it, can't estimate! No napkin math possibility! I generally look at a service pricing to understand what usage pattern would be expensive and what would be the most efficient way to use a service and take advantage of the pay as you go pricing. Corey Quinn has written enough about why this is not OK and I'll try not rant about it anymore, however I'm not giving up on Aurora DSQL, so I shall find out the hard way!
Update: The user guide now documents the formulas, but that appears to have happened after my original October 2025 work. They are still not on the pricing page where I would normally expect to find them, but this is good enough! I have updated the blog post.
Unit based pricing
Unit-based pricing is the new trend of AWS pricing for new serverless services; however, other services have been more specific on what a unit is.
- Like DynamoDB "Read/Write Request Units" and Application Load Balancer "Load Balancer Capacity Units" but they told us how to exactly calculate it.
- Like Athena "Data Processing Units" but at least they said "4 vCPU and 16 GB of memory"!
- Like "Redshift Processing Units" but at least they said it provides 16 GB of memory!
- Like "Aurora Capacity Units" but at least they said "ACU has approximately 2 GiB of memory with corresponding CPU and networking"!
- Like "Timestream Compute Units" but at least they said "TCU comprises 4vCPU and 16 GB of RAM"!
- Like "ElastiCache Processing Units" but at least they said "Reads and writes require 1 ECPU for each kilobyte (KB)"
- Like "OpenSearch Compute Units" but at least they said "6 GB of RAM"
Some more history
- 2016 AWS announced Athena, Query S3 With SQL and pay only $5 per TB scanned! Only remarkable limit was 30 minutes query time!
- (Speculation) Naturally some people abused it to do nested loop cross joins of regexes or in other words, computationally expensive stuff that cost Athena more than what it charged!
- 2018 AWS announced Timestream, serverless SQL time series database that has no hourly charges and instantly available. It was ahead of its time. Pay $10 per TB scanned, $0.03 per GB stored per month for magnetic storage. S3 is $0.023. This was an amazing deal for the right use case!
- (Speculation) Naturally some people abused it!
- 2017-2024, AWS announces more serverless data tools everything now priced in processing units instead of per GB scanned!
- Times are tough, some cuts are made to some services! Timestream pricing is changed into processing unit for new customers.
- There's also other distributed serverless databases priced in "Request Units" without a lot of details(some better than others!)
- Aurora DSQL pricing came out in DPUs but no explaination.
- Later the formula came into the docs quietly.
What are the different DPUs?
- ComputeDPU
- ReadDPU
- WriteDPU
- MultiRegionWriteDPU
The AWS docs definitions for these metrics:
WriteDPU: approximates the write active-use component of your Aurora DSQL cluster DPU usage.MultiRegionWriteDPU: for multi-Region clusters, approximates the multi-Region write active-use component.ReadDPU: approximates the read active-use component of your Aurora DSQL cluster DPU usage.ComputeDPU: approximates the compute active-use component of your Aurora DSQL cluster DPU usage.TotalDPU: approximates the total active-use component of your Aurora DSQL cluster DPU usage.
The billing docs define TotalDPU for a single-Region cluster as:
TotalDPU = ComputeDPU + ReadDPU + WriteDPU
For multi-Region clusters, there is an additional MultiRegionWriteDPU component. The docs say it is equivalent to WriteDPU for the synchronously replicated write and is charged in the Region where the write originated.
So the formulas exist, but the hard part remains: figuring out how many bytes your workload actually reads and writes, and how much compute time the query plan consumes. That's why benchmarking is still useful.
Some interesting limits
- Max query memory: 128 MiB
- Max combined size of the columns used in a primary key: 1 KiB
- Max combined size of the columns in a secondary index: 1 KiB
- Max connection duration: 60 minutes
- Maximum size of a row in a table: 2 MiB
- Maximum connections per cluster: 10,000 connections
- Maximum connection rate per cluster: 100 connections per second
- Maximum connection burst capacity: 11,000 connections
- Connection Refill Rate: 100 connections per second
This gives us an idea of the scale we can benchmark and how to push it to its limits. It also highlights what AWS is providing for free: connections don't cost us anything, but they incur backend costs for AWS, which explains the limits.
Experiment flow
- Run query that isolate write, read or compute aspects of queries.
- Check for metrics of the cluster in CloudWatch after about 1-2 minutes.
- Run more queries one at a time per cluster!
- Realize it's too slow and make more clusters!
- Decide to go multi region because only 20 clusters can be in single regions!
- After making 80 clusters, realize the 20 cluster limit is account wide not regional limit but you got 80 clusters because eventual consistency worked in your favor!
- After 6 months, realize the DPU metrics also show up under EXPLAIN ANALYZE VERBOSE.
What metrics?
Luckily aside the various DPU components CloudWatch also exposes the following metrics which can help us with understanding of how usage is metered:
BytesWritten: bytes written to storage.BytesRead: bytes read from storage.ComputeTime: Query processing wall clock time, in milliseconds.
Simple inserts
I made a few different inserts with different sizes and with different sorts of primary key to see if it has any effect on any indexing.
First, we'll see if BytesWritten directly correlates with the data size.
Please forgive my lack of data visualization and analysis skills. These charts were good enough for me!
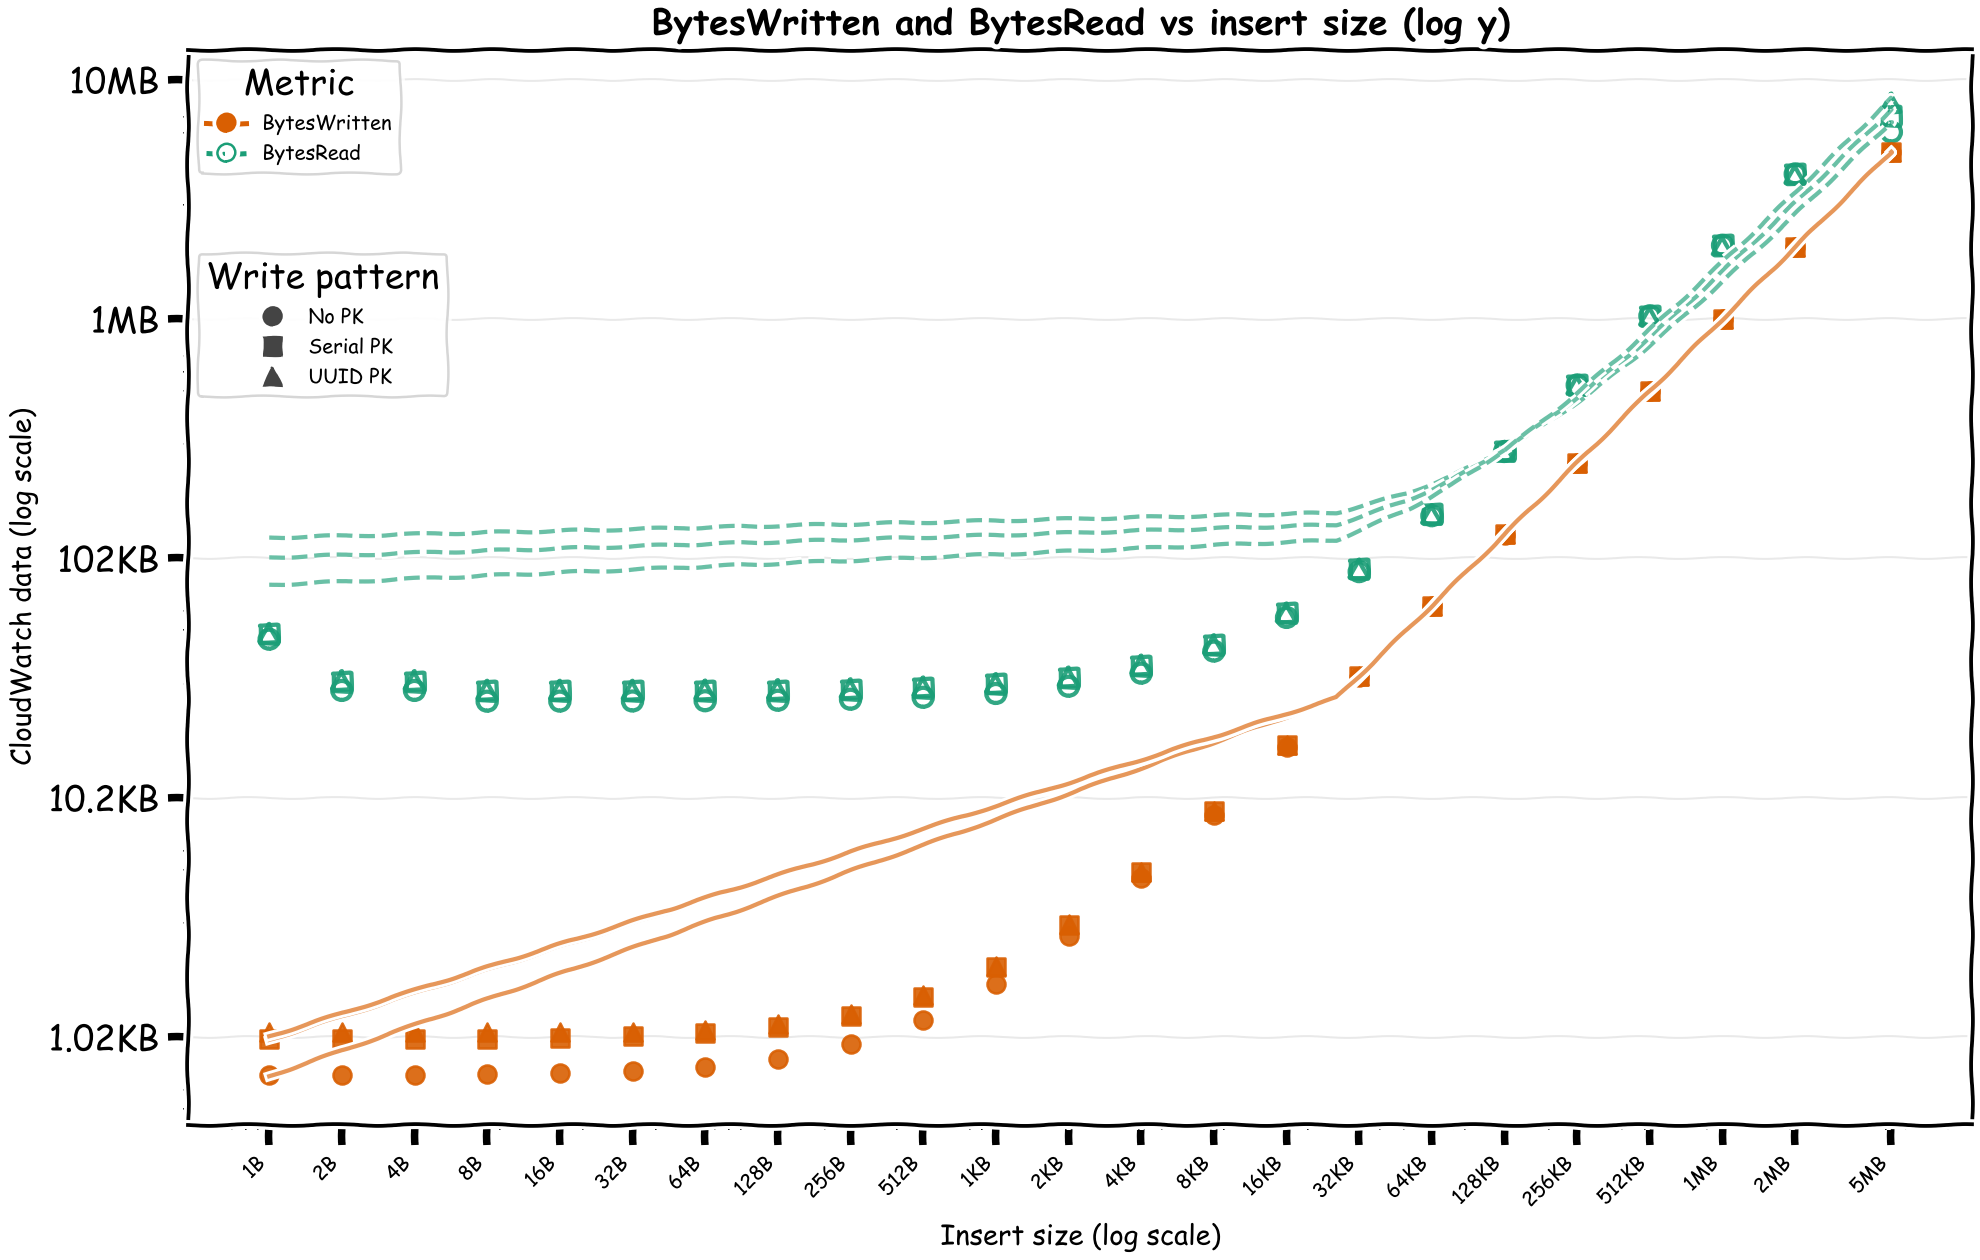
We can see the BytesWritten is roughly as the insert size, but we also have BytesRead which are slightly more than the insert size.
Small writes have relatively fixed costs but after a certain point, the cost starts to increase linearly with the size of the writes. If the pricing is built on top of how EBS prices, there's both an I/O and throughput components while also I/O count depends on the size of the read/write operation.
Let's limit the chart to writes that are more than 100KB at time and see if we can find a linear relationship between the inserted size and the WriteDPU.
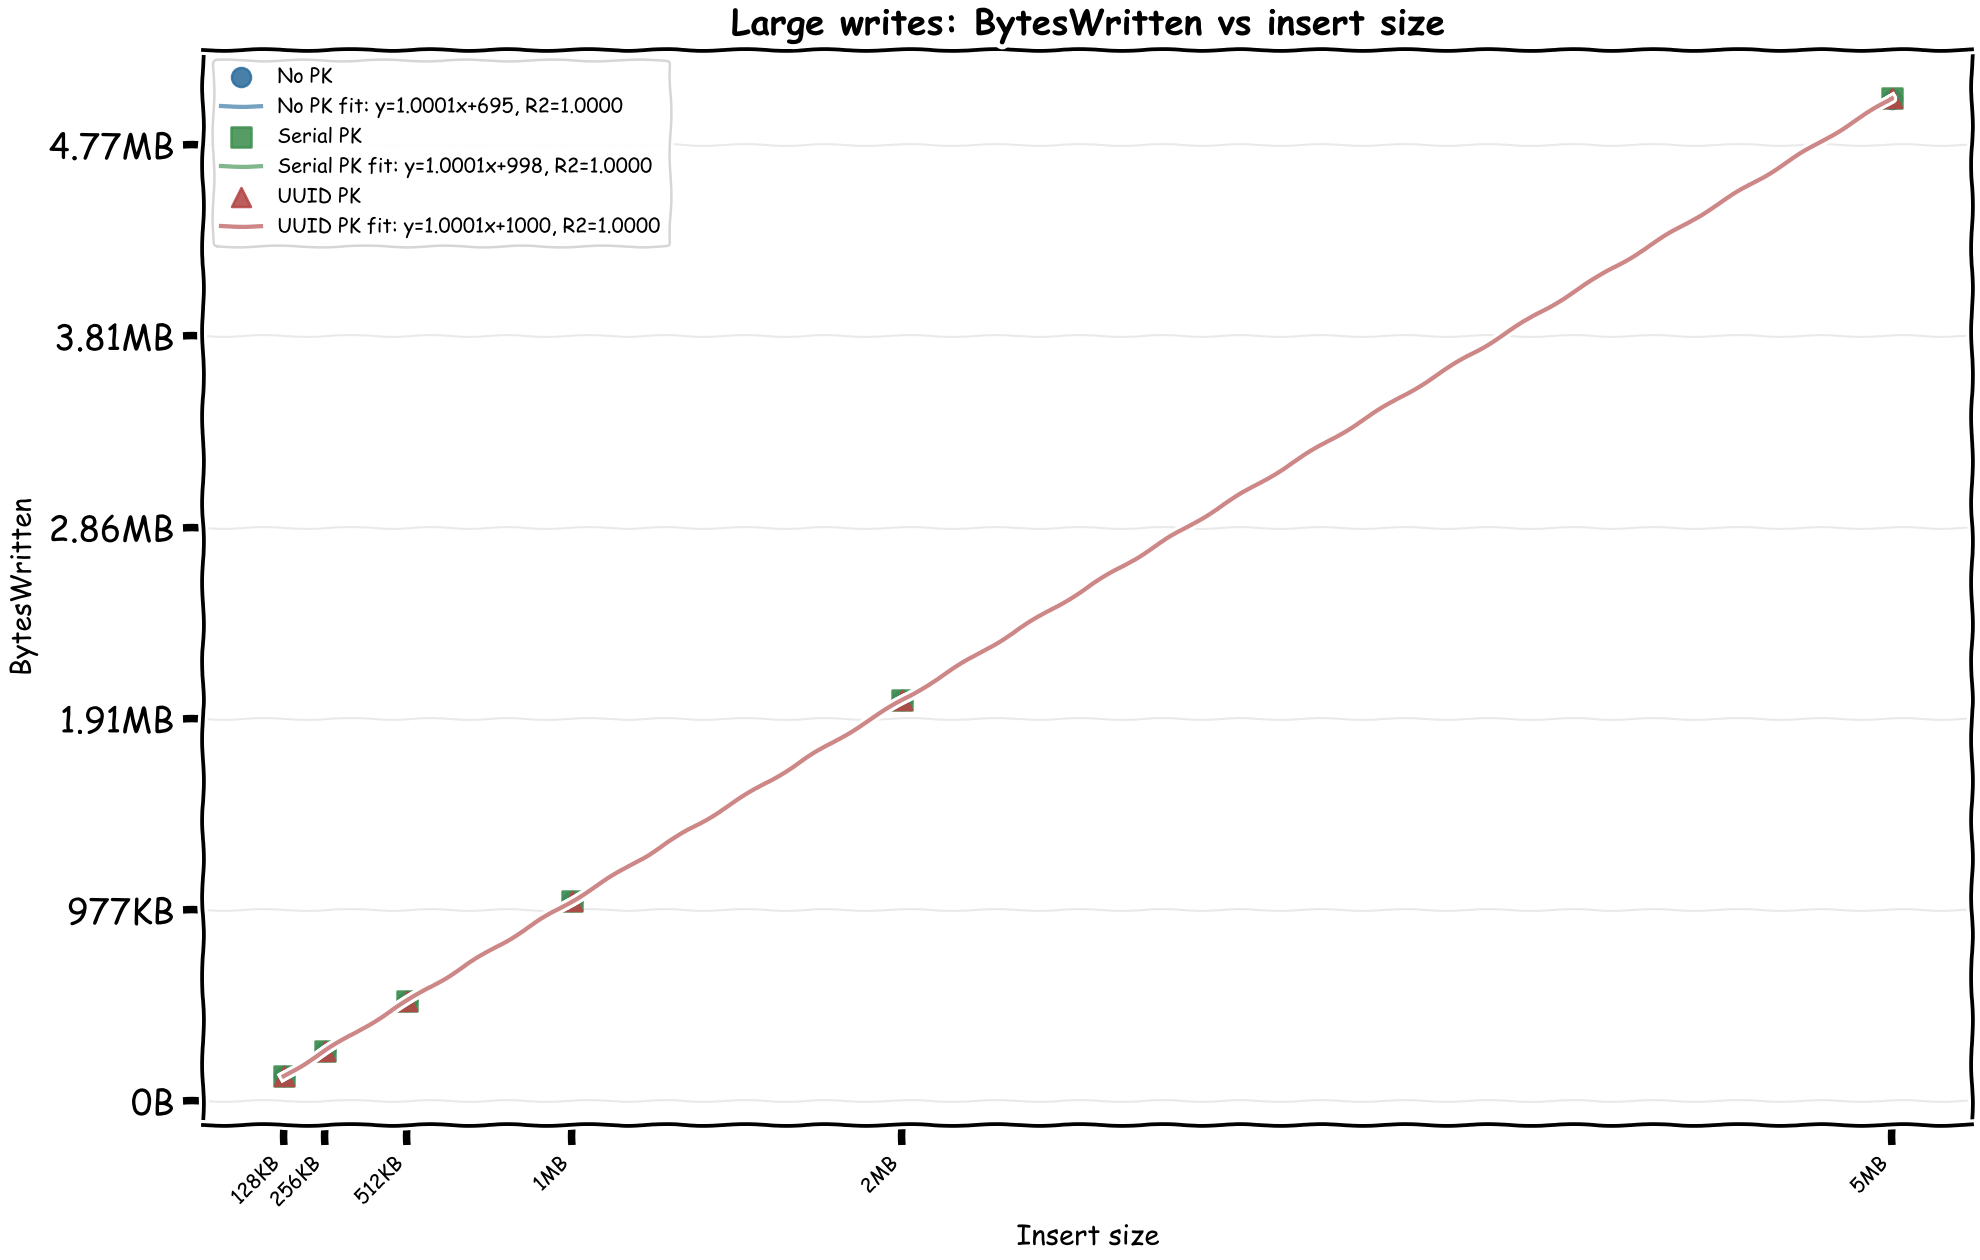
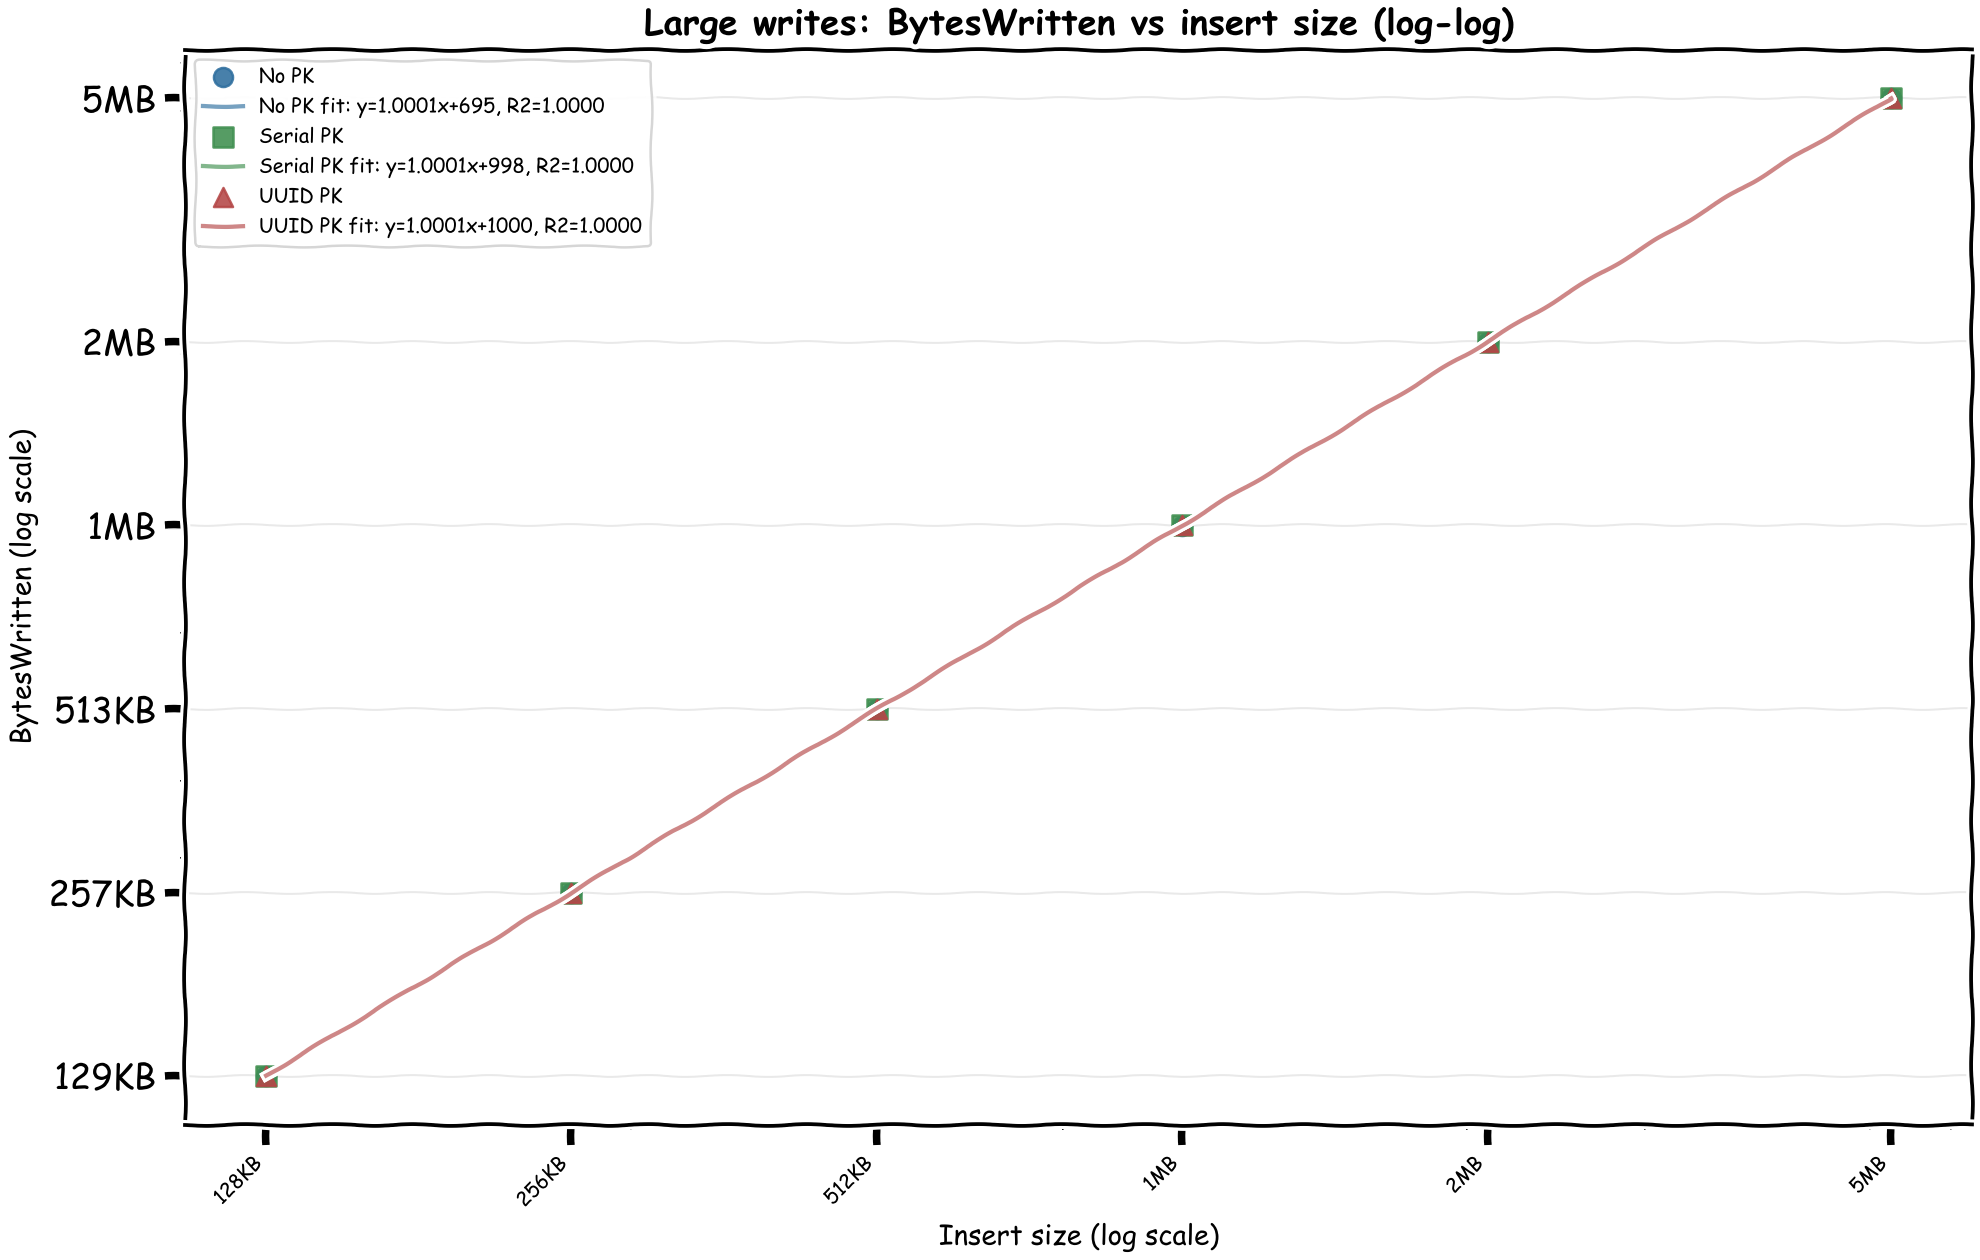
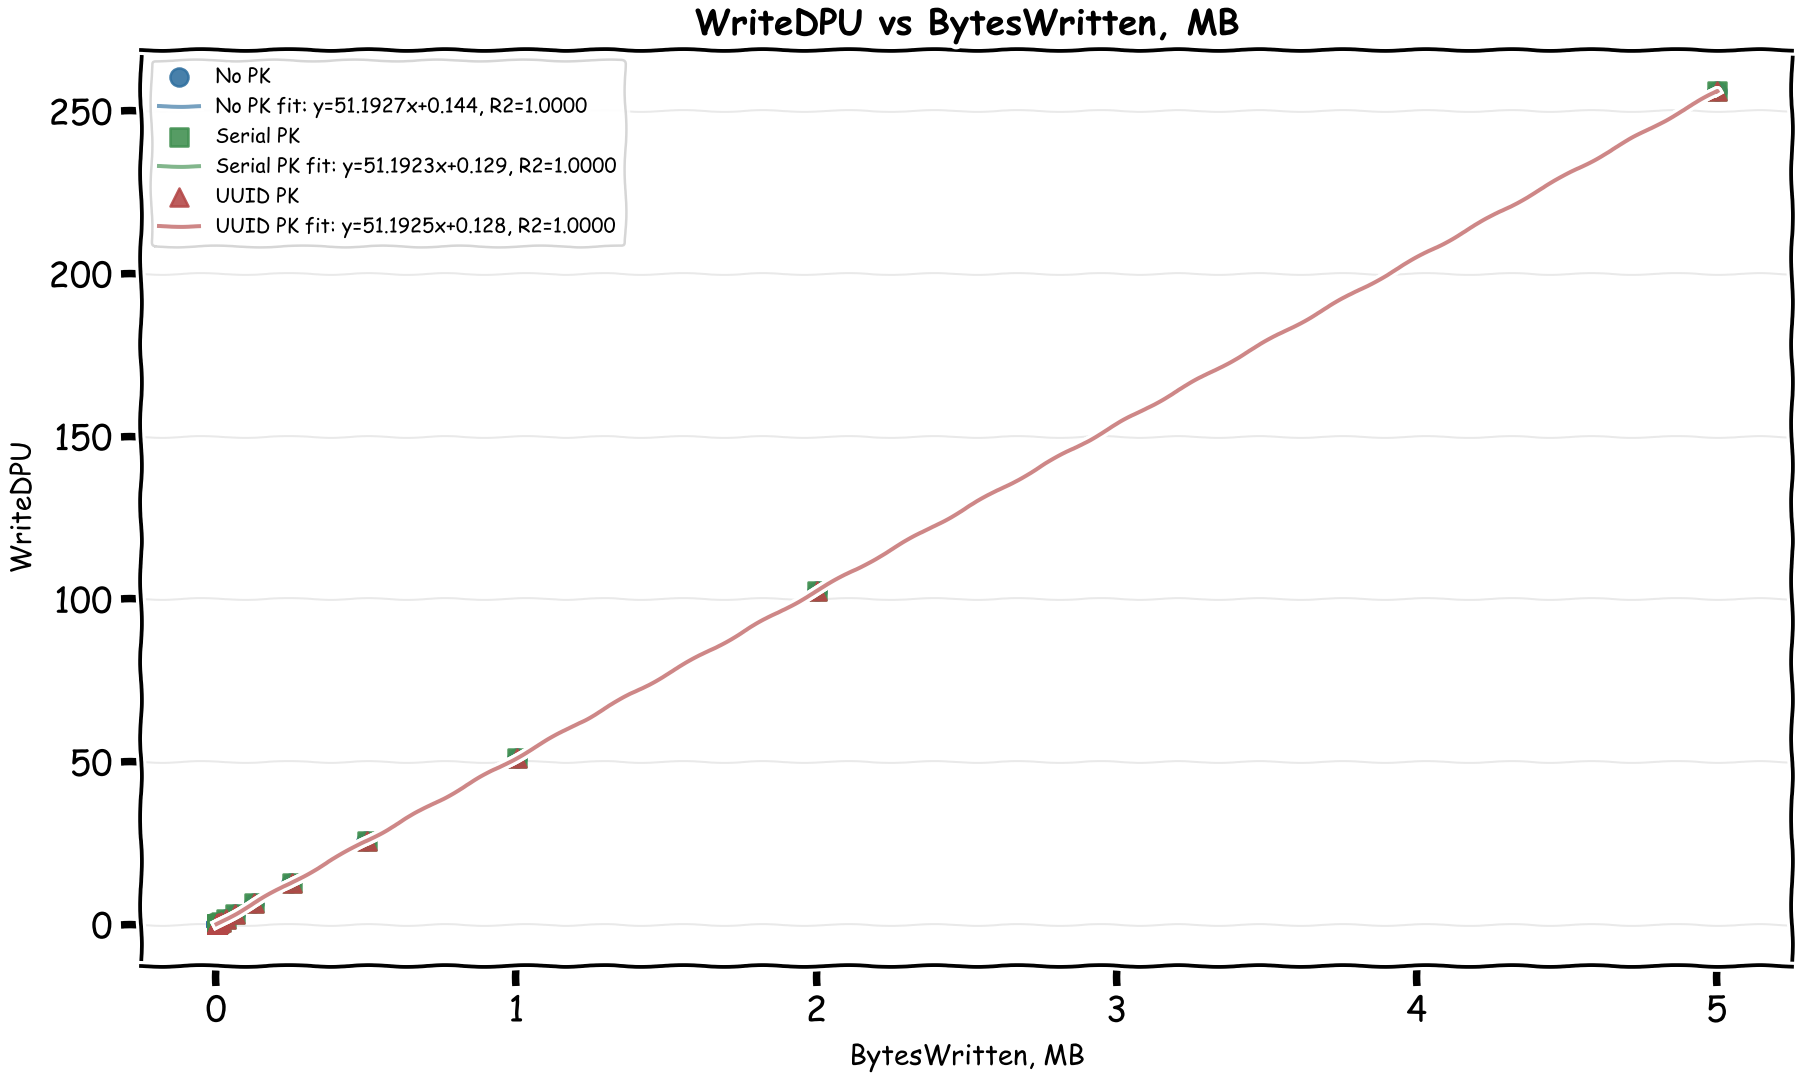
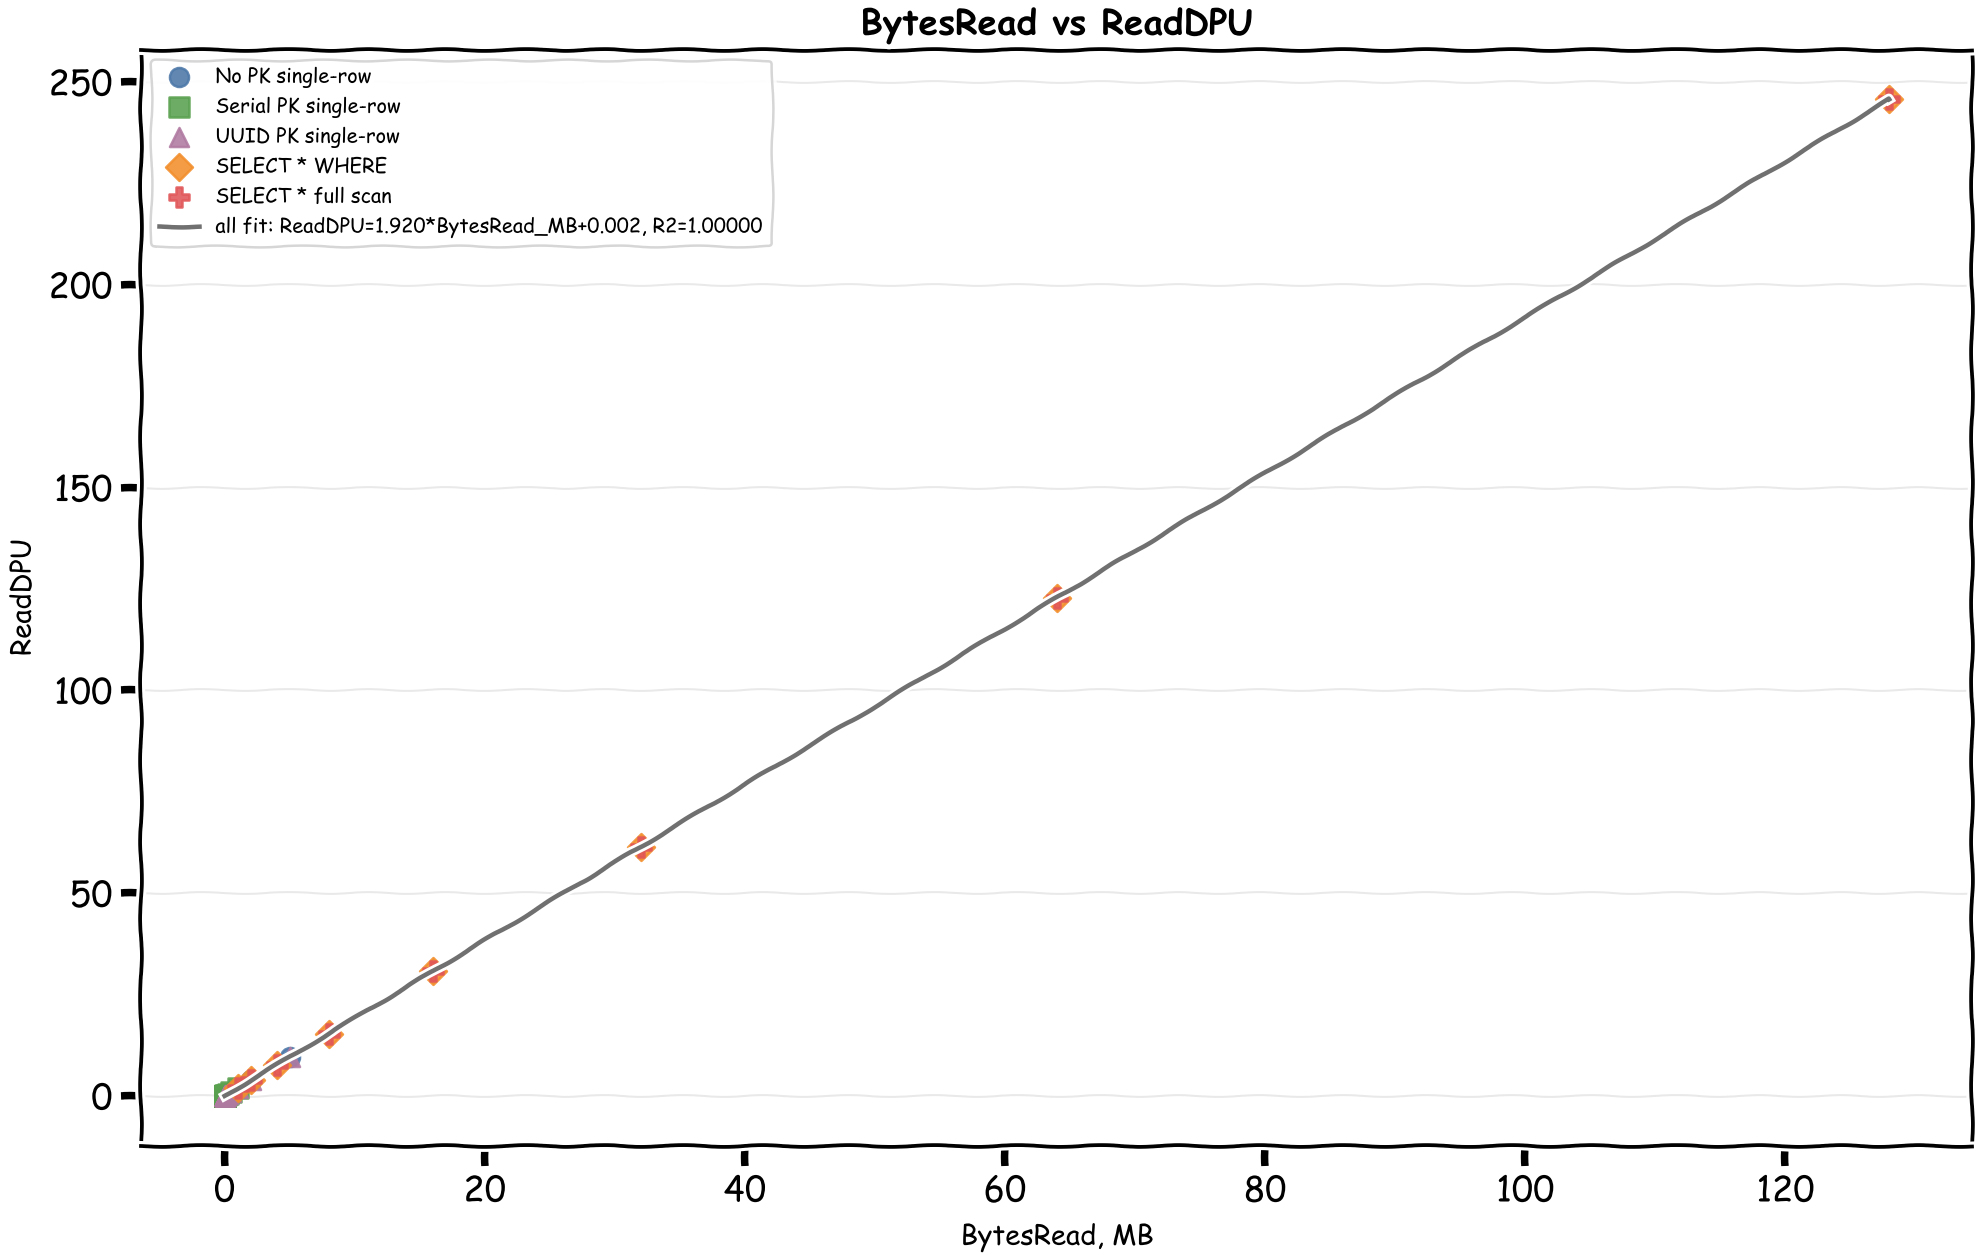
Bingo! We can immediately see there's a linear relationship between the CloudWatch byte metrics and DPUs. In the April 28, 2026 rerun, the formulas come out as:
- WriteDPU = 51.19 × MiB_Written + ~0.59
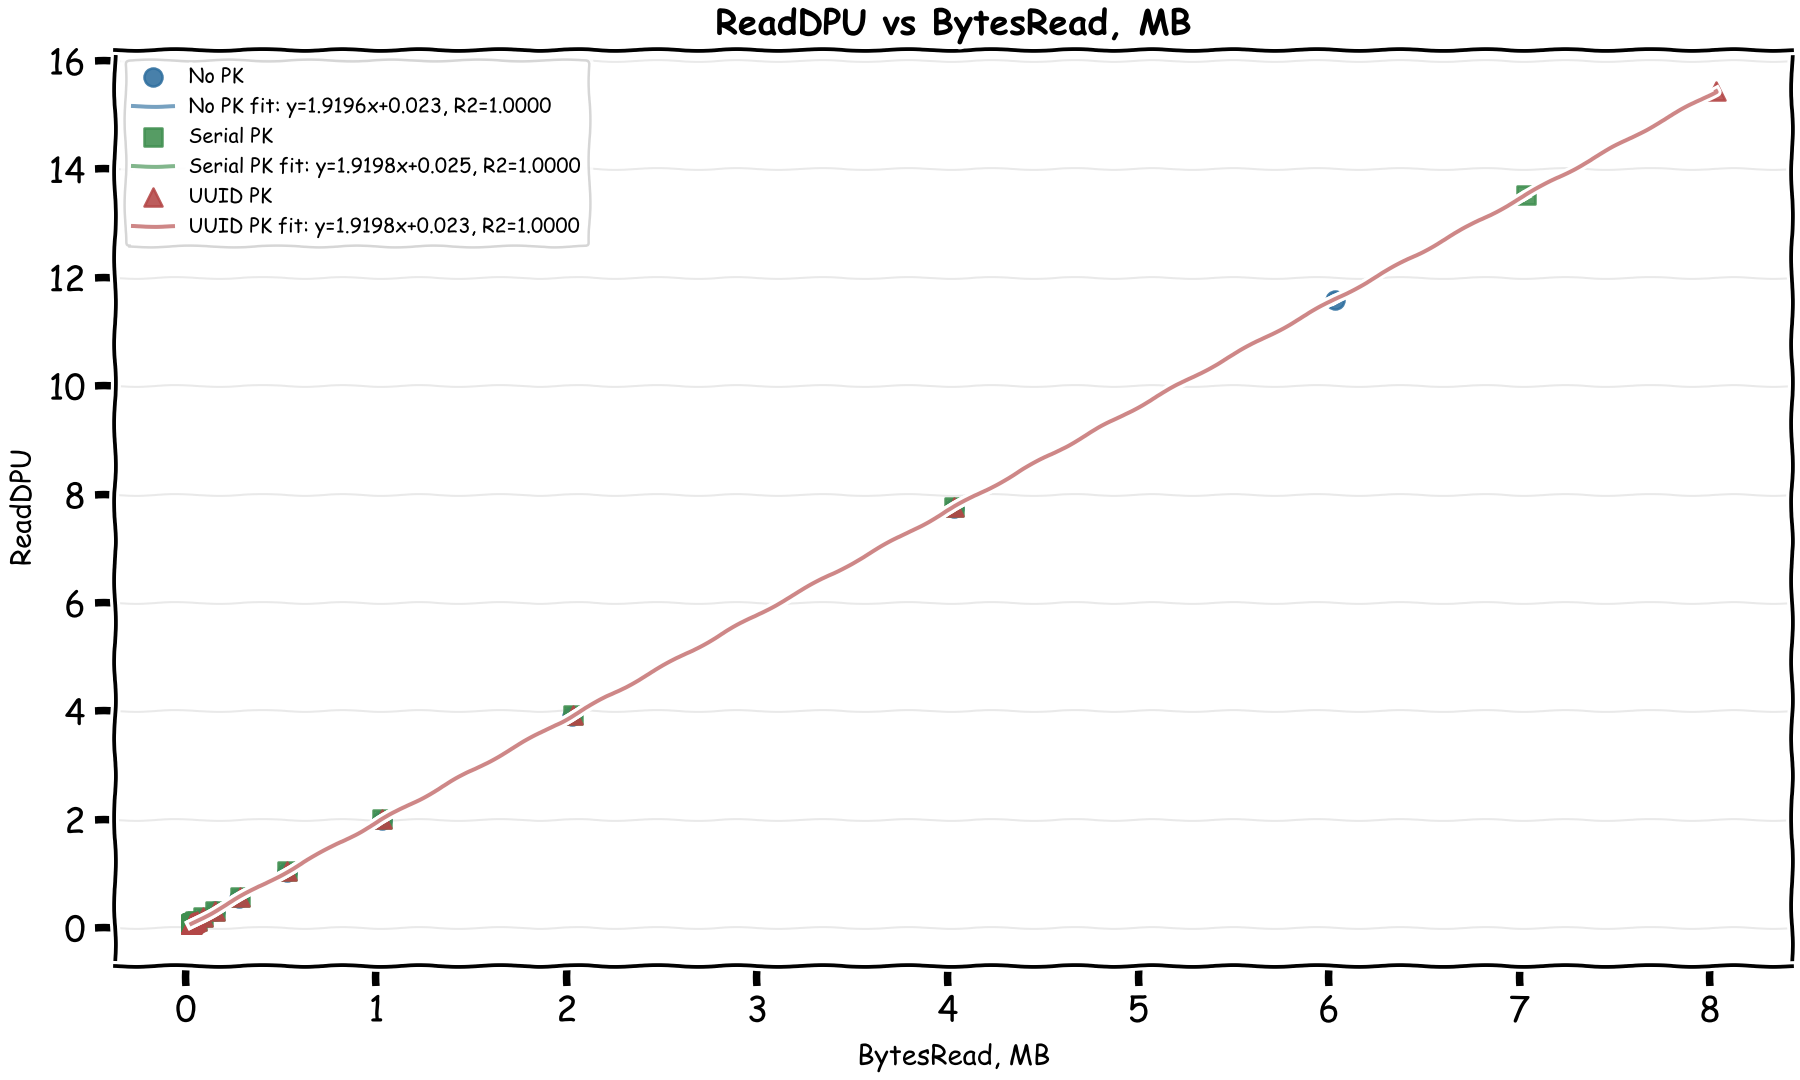
- ReadDPU = 1.92 × MiB_Read + ~0.008
This matches the documented formulas almost exactly:
WriteDPU = max(Bytes Written, 1024) x 0.00004883ReadDPU = max(Bytes Read, 2048) x 0.00000183105
In MiB, those become about 51.20 WriteDPU per MiB and 1.92 ReadDPU per MiB. The docs also mention two minimums that matter for small operations:
- Writes bill each row smaller than 128 bytes as 128 bytes, and a write transaction smaller than 1,024 bytes as 1,024 bytes.
- Reads have a 128-byte per-partition minimum and a 2,048-byte transaction minimum.
It's interesting to see that writes are around 27 times more expensive than reads by byte. My thinking is that writes are first written to 2 journals and then written to 3 different storage locations while the writes are strongly consistent. The small fixed costs in the charts are not mysterious anymore either: at least some of them are the documented transaction and row/partition minimums.
What about compute time?
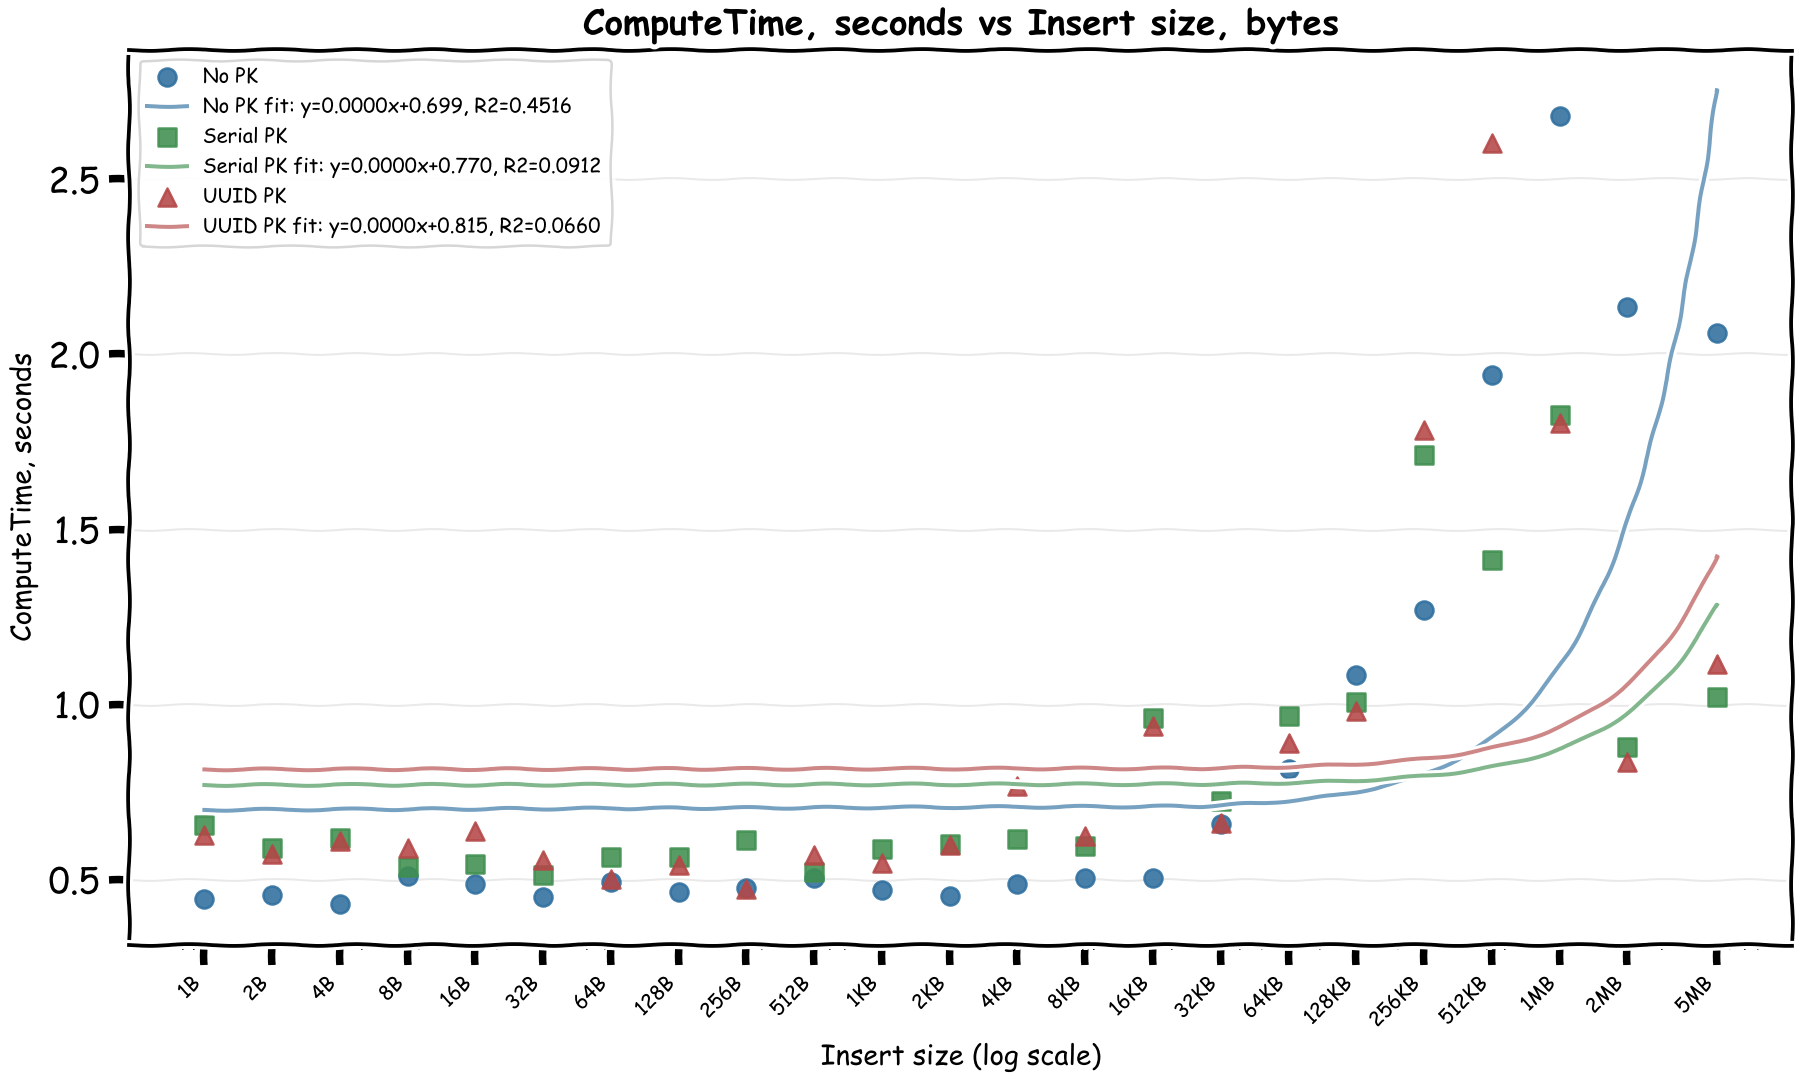
Mostly fixed and then at 1MB it increases sub-linearly. Note that for the last values, multiple rows were inserted to work around the 2 MiB row limit, which could explain the sub-linear increase as different rows were written in parallel.
Let's check compute time vs compute DPU:
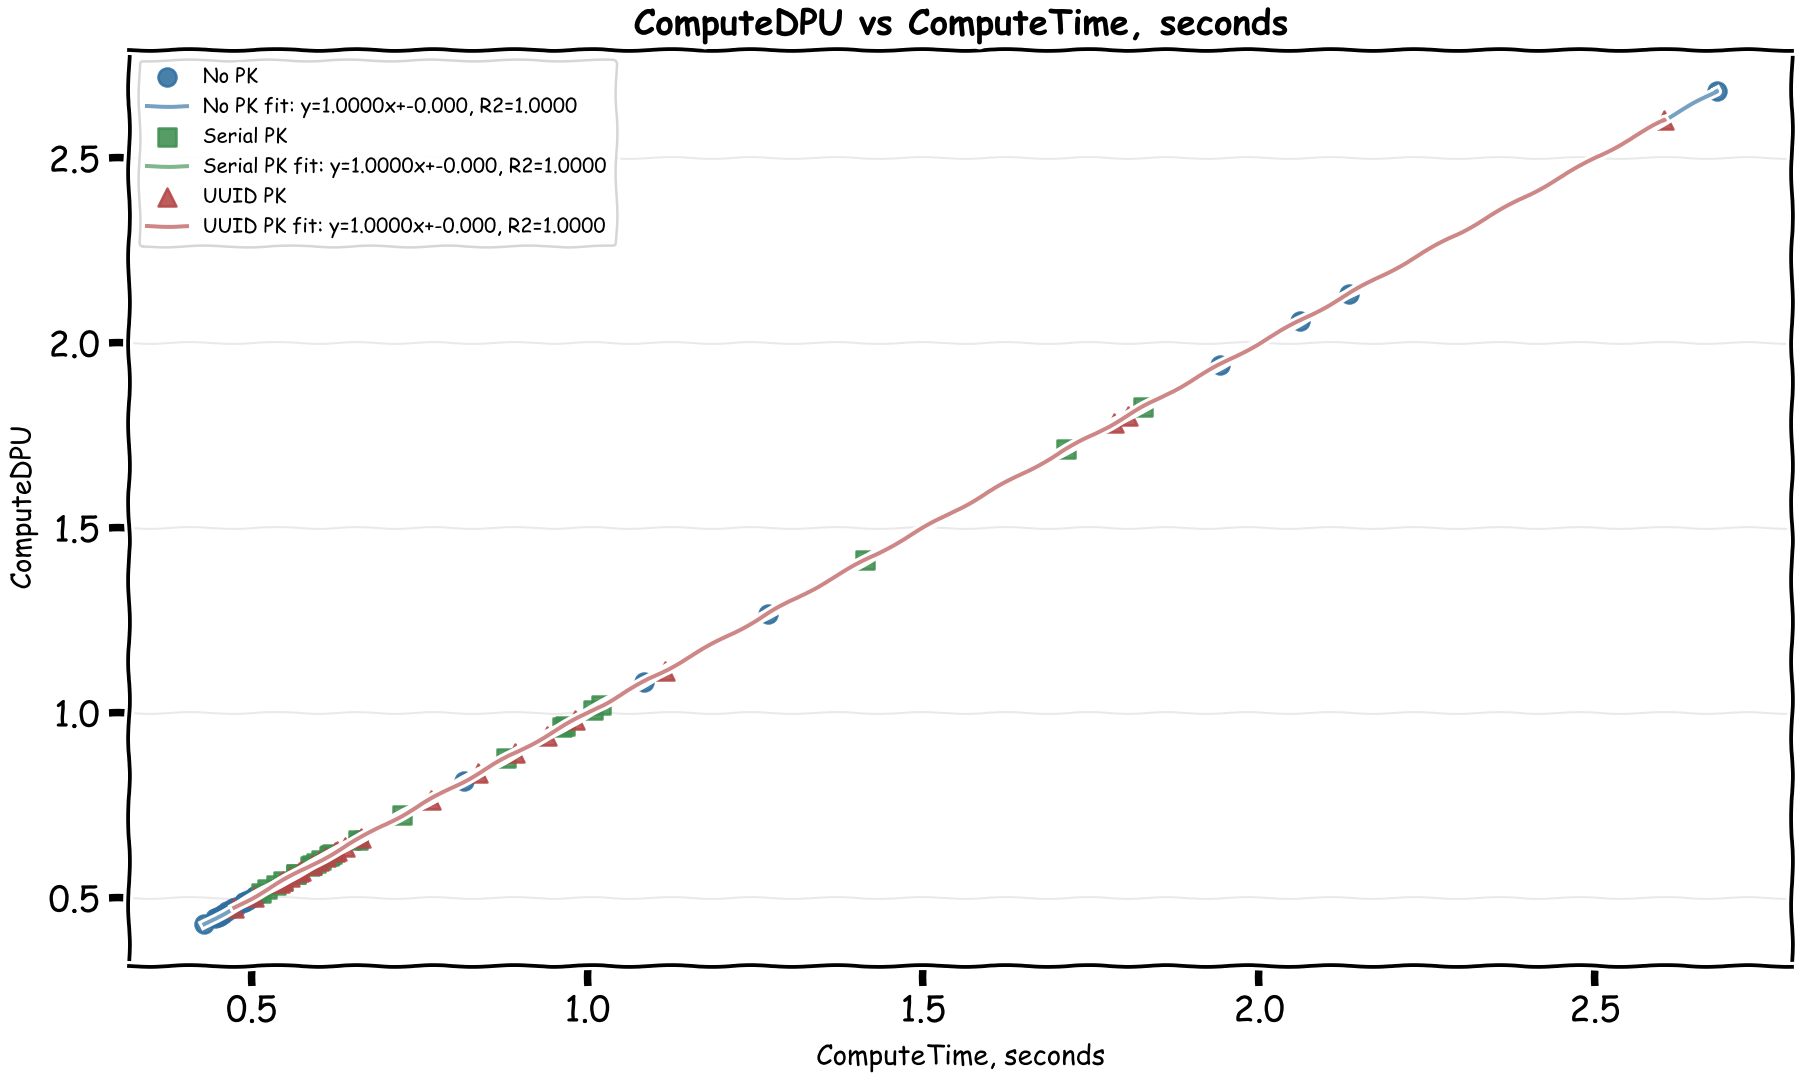
Well this is an easy one! Each ComputeDPU is basically 1 second of total processing time. The billing docs confirm this too.
If a 1 million DPU costs $8, then 1 DPU costs $0.000008. With 1 second compute time per DPU, that comes to $0.000008 per second of compute time, which is $0.0288 per hour of compute time.
This is a very reasonable cost, AWS load balancer costs $0.0225 per hour. The extra could cover a t4g.nano and a 20% premium that's been typical with managed serverless services vs EC2 instances.
Bringing it all together
If we put the formulas together, we can get a rough estimate of the DPU cost of a query based on the data size we insert:
WriteDPU = 51.19 × Write in MiB + ~0.6ReadDPU = 2.85 × Write in MiB + ~0.3ComputeDPU = 0.36 × Write in MiB + ~1.6
The second line is not the documented ReadDPU formula directly; it is the read side effect I observed while writing, because Aurora DSQL reads the primary key index to verify uniqueness before writing. Let's take the ComputeDPU formula here with a huge grain of salt as I'm quite sure it wouldn't be linear at all.
Reads?
Now that we have a documented linear relationship between the read and write byte metrics and the DPUs, we can focus on to see how different query shapes affect the read metrics and therefore the DPUs.
First, query output size versus BytesRead, then BytesRead versus ReadDPU.
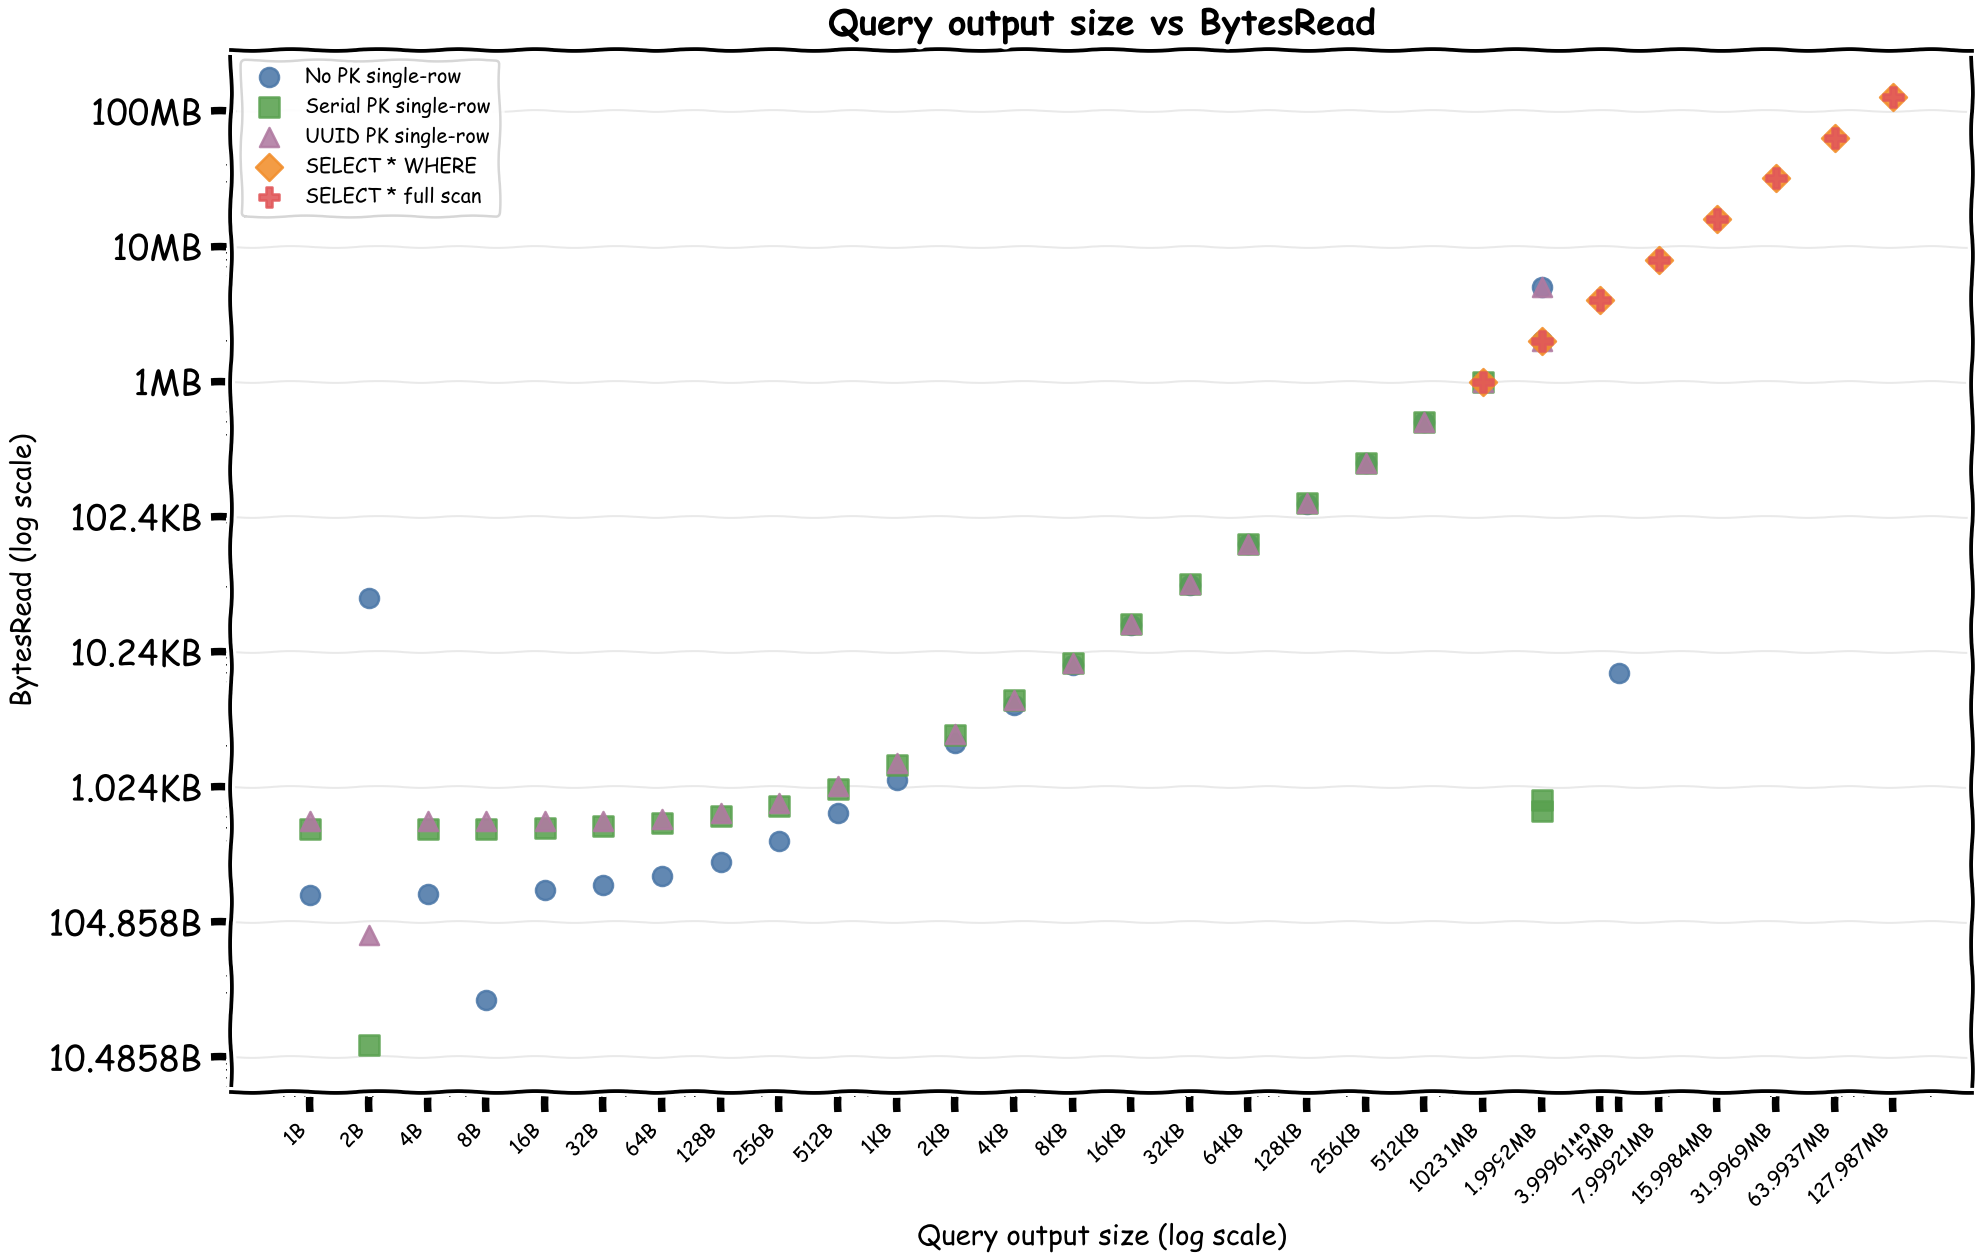
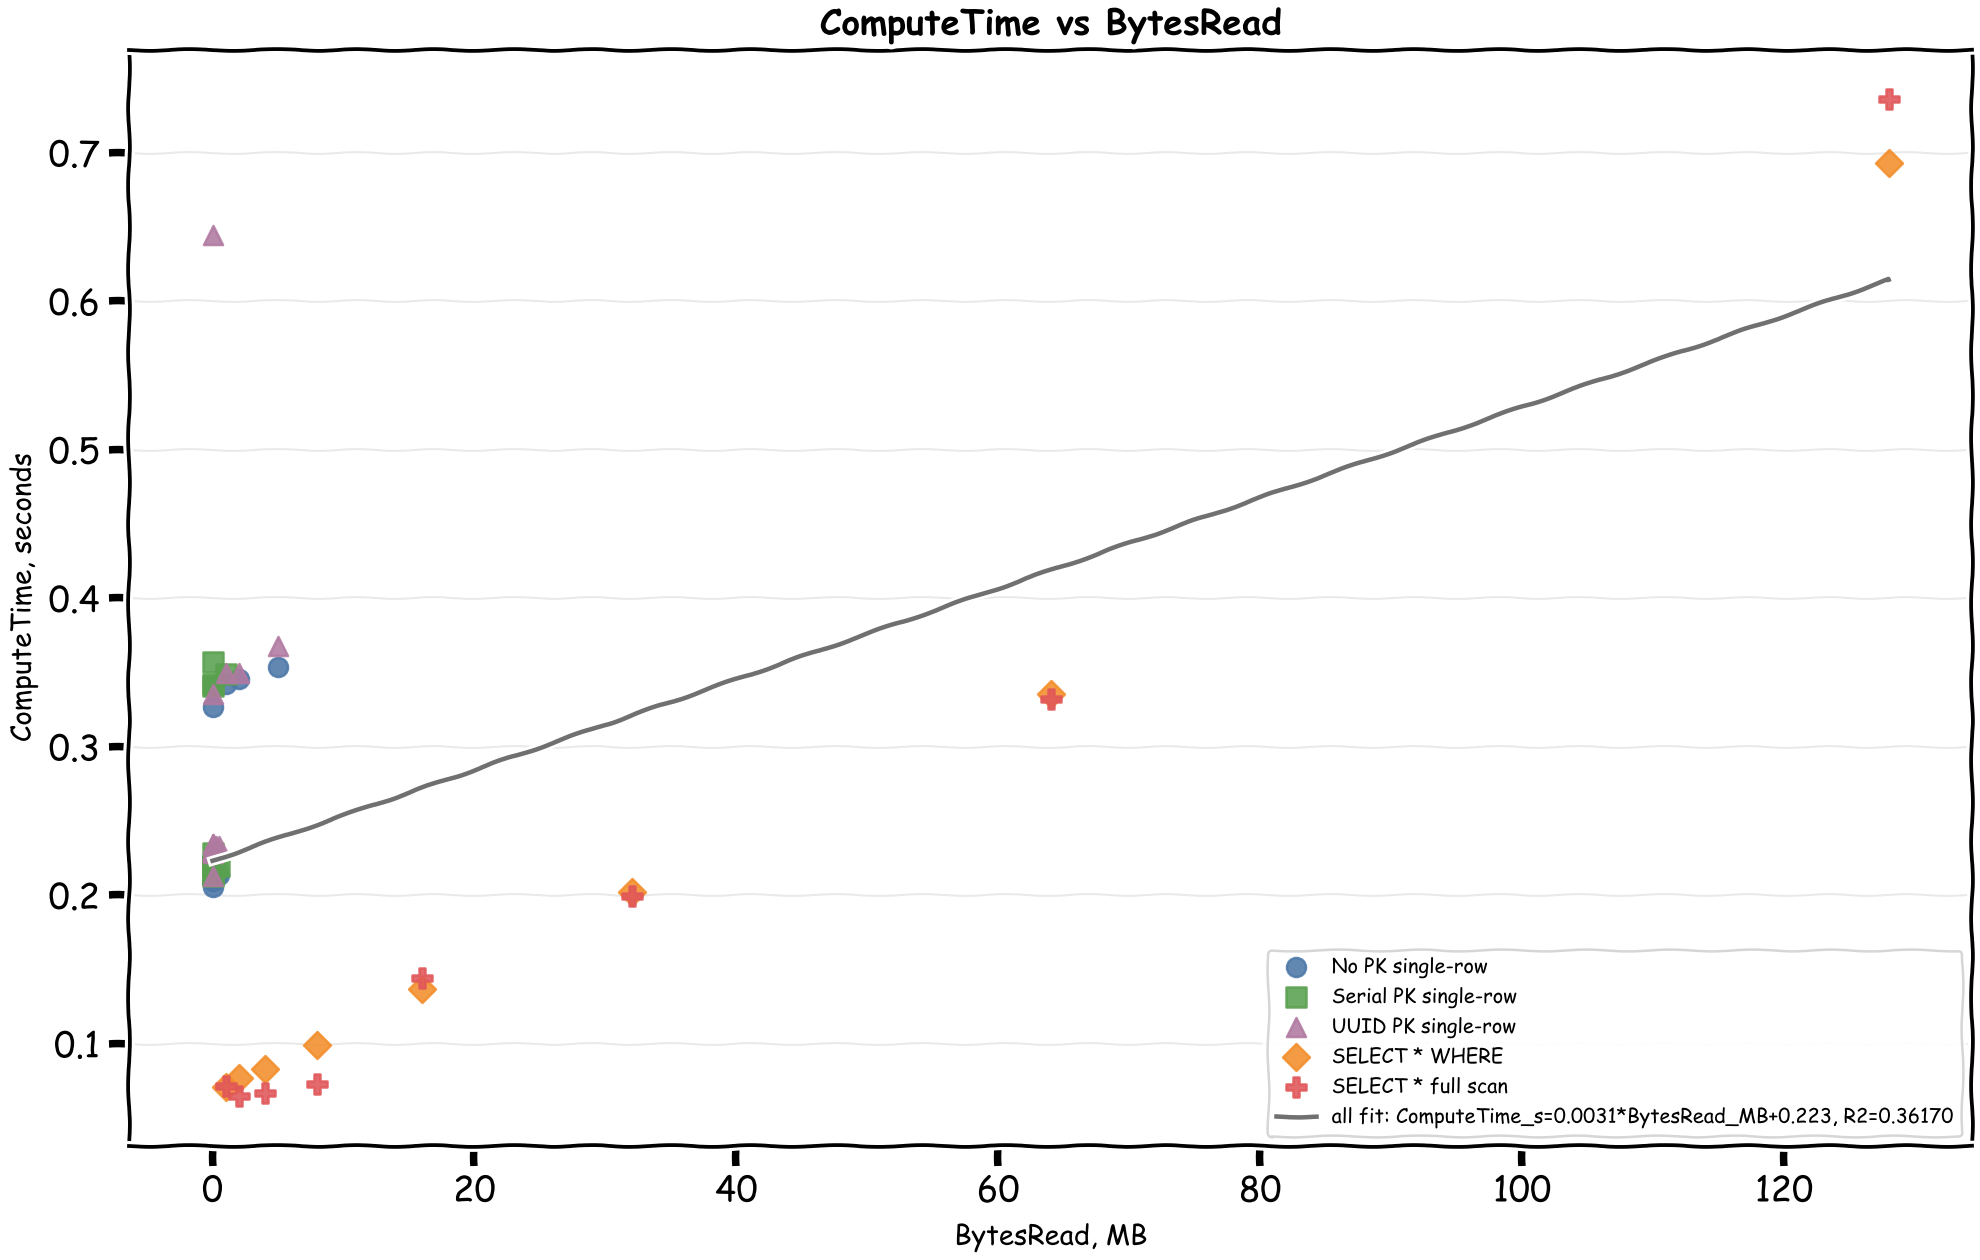
And then ComputeTime versus BytesRead:
Here's a table of different patterns reading 1 row of 1MB data:
| Scan Type | BytesRead | ReadDPU | ComputeDPU | TotalDPU | Cost |
|---|---|---|---|---|---|
| No PK | 1.00 MB | 1.92 | 0.34 | 2.26 | $0.000018 |
| Serial PK | 1.00 MB | 1.92 | 0.35 | 2.27 | $0.000018 |
| UUID PK | 1.00 MB | 1.92 | 0.35 | 2.27 | $0.000018 |
| WHERE PK < x | 1.00 MB | 1.92 | 0.07 | 1.99 | $0.000016 |
| FullScan | 1.00 MB | 1.92 | 0.07 | 1.99 | $0.000016 |
Compute DPU was a lot higher where index had to be used interestingly since we there was only 1 row in the database this wasn't as efficient.
This was also cheaper than I expected in all cases. When comparing with the price of Athena this is about 3.7x more. This is also more expensive than timestream, but still not significant enough.
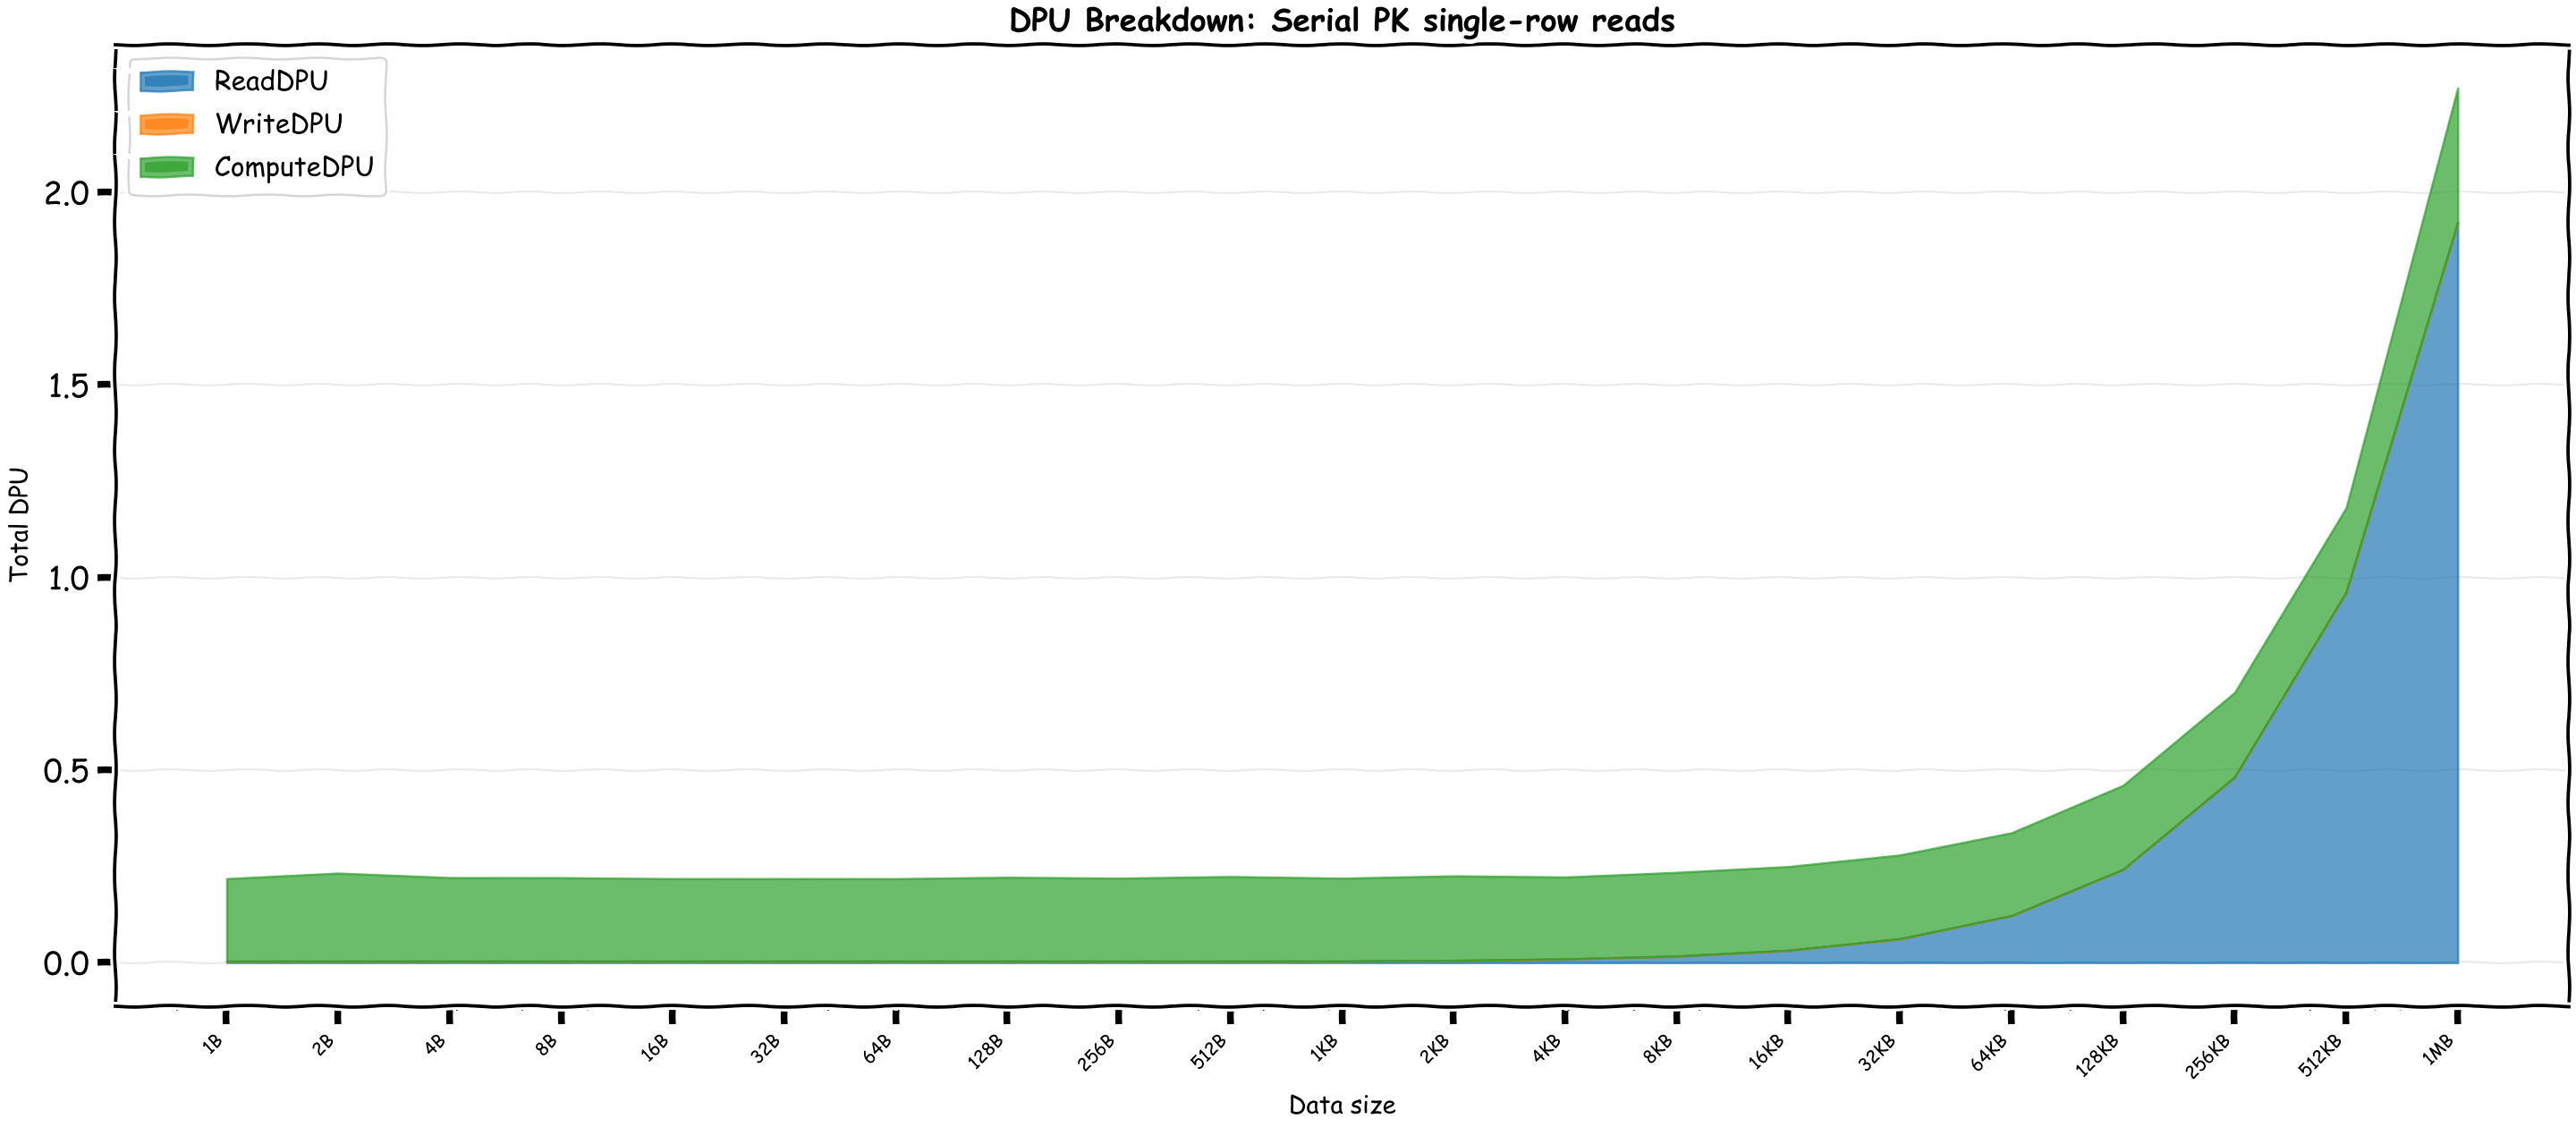
Let's see the total DPU with different query sizes for Serial PK:
Heavy operations vs Compute time?
We saw compute time remains efficient across reads so I tried to do some heavy operations, turns out Aurora DSQL is pretty good at keeping things fast, but naturally the operation type and the number of rows make a big difference.
| Operation Type | Avg Throughput | Avg ComputeDPU |
|---|---|---|
| Simple Cross Join | 3.5M rows/sec | 1.68 DPU |
| Sort | 296K rows/sec | 0.32 DPU |
| Regex (50 rows) | 156 rows/sec | 0.22 DPU |
Real world applications
I tried to look for real applications that I could run on DSQL, however Claude research came up with these amusing newspaper like headlines showing us the world is still not ready for it!


So I decided to do some tests with the numbers from one sampled application. Here's what the read/write patterns look like:
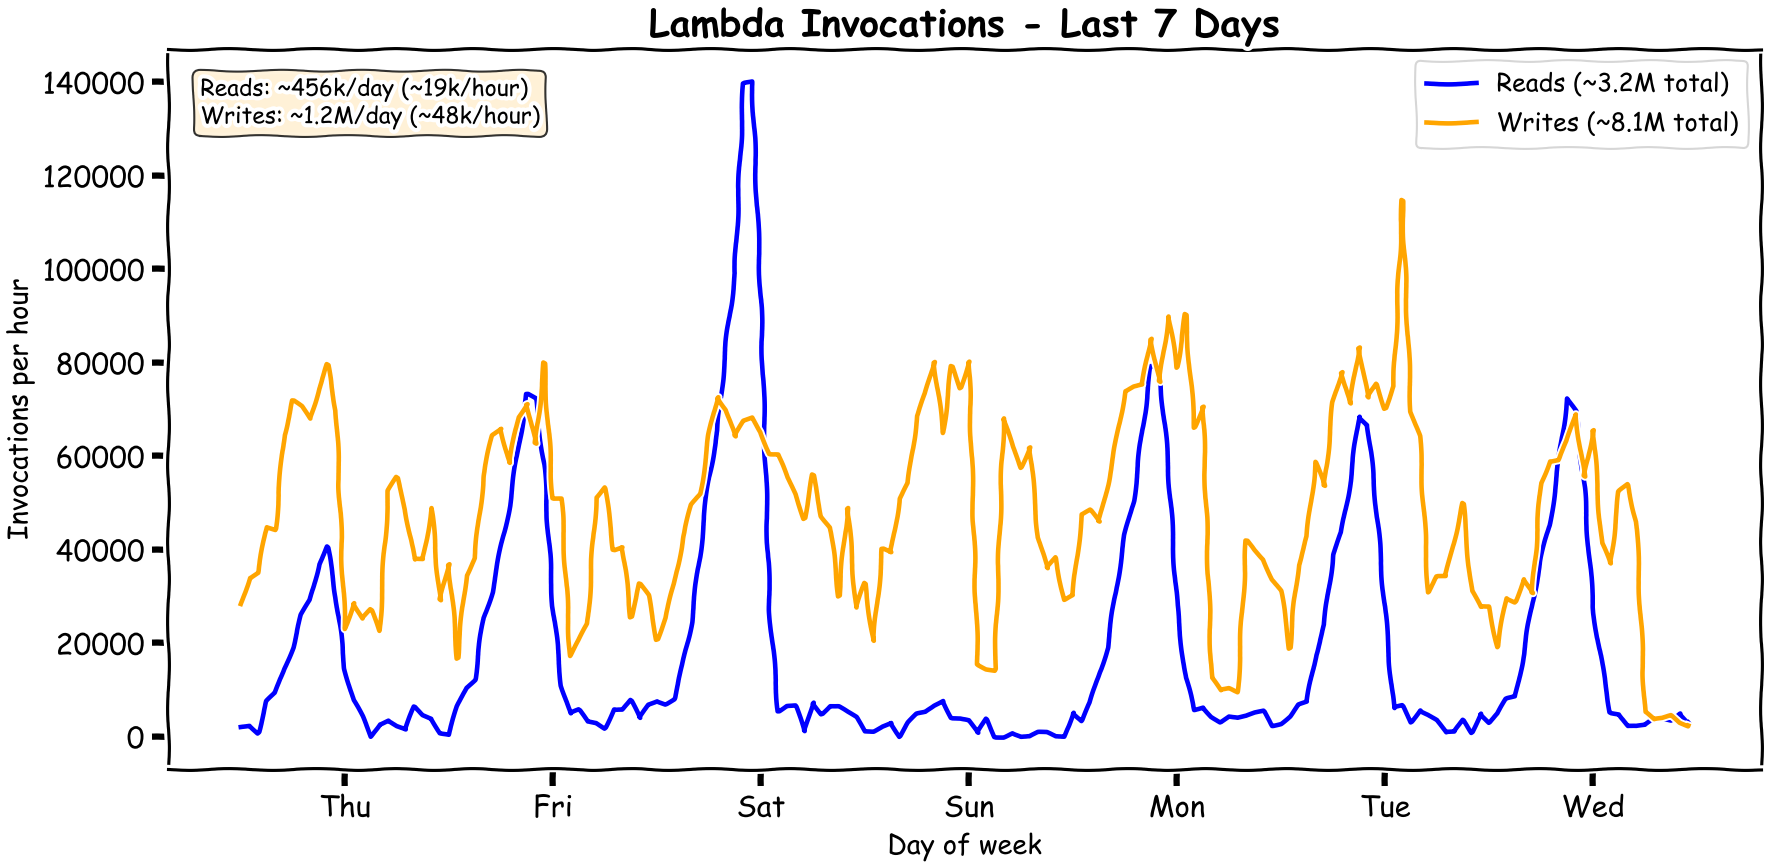
You can see it's quite bursty. The patterns change over time and as usual it's always the peaks getting higher while the troughs stay low.
After some tests we come to the following:
- Writes: ~$25/month
- Reads: ~$10 to ~$20/month
This is amazing as the current costs are $100 monthly for vanilla RDS to ensure it can keep up with the writes. Of course I'm not going to change the client's architecture to save $50 as the read replicas of this RDS instance are used for an ad-hoc analytical queries that wouldn't be suitable for DSQL, as I would be scared of a few bad queries bankrupting us.
Comparison with DynamoDB?
For DynamoDB Standard tables in on-demand mode, reads are charged in 4 KB chunks and writes are charged in 1 KB chunks. Transactional reads and writes use 2 request units per chunk. In us-east-1 pricing at the time of writing, read request units are $0.125 per million and write request units are $0.625 per million.
I used a 16 KB DSQL single-column rows test to compare to ensure the fixed costs aren't dominating and larger sizes would linearly scale. DynamoDB reads round in 4 KB chunks, so a 16 KB transactional read is 8 read request units. DynamoDB writes round in 1 KB chunks, so a 16 KB transactional write is 32 write request units. This comparison excludes storage, indexes, free tier, global tables, and any discount programs.
| Operation | DSQL CloudWatch bytes | TotalDPU | ComputeDPU | Total / 1M ops | Compute Cost 1M ops | DynamoDB 1M ops |
|---|---|---|---|---|---|---|
| 16 KB read | BytesRead=16,549 |
0.24 | 0.21 | $1.95 | $1.70 | $1.00 |
| 16 KB write | BytesWritten=17,107, BytesRead=59,192 |
1.60 | 0.50 | $12.77 | $4.03 | $20.00 |
This is actually pretty amazing. It shows that compute is a significant part of reads which I guess can be more efficient as data size grows. Excluding the compute part which is only fair given SQL is a turing complete language, the write price is actually beating DynamoDB transactional writes.
Previous benchmarks
Initially I had done this for a talk in the local AWS meetup in October 2025, however being busy with work I didn't get to publish it in this blog. The detailed billing formulas appear to have shown up in the AWS docs later, around late November 2025, so at the time I had to reverse engineer the DPU behavior from CloudWatch metrics. I reran the same benchmarks and noticed some changes interestingly. While the write and read DPU formulas were mostly the same, the total DPUs for reads reduced significantly. Some of that is from fixing the benchmark window so setup writes are not counted as part of read queries. I'm hoping the remaining compute reduction is not a temporary artifact and is here to stay.
Last words
One thing for sure, I found Aurora DSQL cheaper than I expected. The pricing is smart to cover AWS's margin for most types of abuse. I'd rather not summarize anything. I think AWS didn't put the pricing in simpler terms due to the nature of relational database queries, as they heavily depend on query plans and index usage. Anyone who's done any sort of query optimization with Postgres knows that there's a world of possibilities on what can happen and what could break the optimizations. I also expect the above to change depending on what features they introduce, hopefully more lower than higher. We've seen how variable LLM pricing has been across models, tokenizers change, but intelligence also increases. Interestingly, another distributed serverless database I'm aware of is TiDB. Its pricing was initially more detailed than DSQL, but I still don't fully understand it, as it isn't clearly documented!
In the case if you were looking for the LLM generated scripts that powered this analysis, it's all chucked in this repository.